E-2 visa approval rate 2026: data by country

About 9 in 10 E-2 applications decided at U.S. consulates end with a visa issued, and that has held for more tan a decade. This guide explains how that figure is calculated, what it leaves out and what the latest data shows by country.
What are my chances? It is the first question most E-2 investors ask. The answers they find online are usually percentages with no source attached. We went to the source.
The U.S. Department of State tracks how many E-2 visas its consulates issue and reject each year and how many are granted to each nationality each month. Using these reports, we calculated the approval rate for each year since fiscal year (FY) 2013, reconstructed the yearly totals back to FY 1997, and compared countries through February 2026. These numbers describe the E-2 program as a whole. However, they cannot predict how your application will be decided; an immigration attorney reviews each case based on its specific circumstances.
E-2 visa data at a glance

The 90.1% approval rate is not an official State Department statistic. Rather, it is calculated from the Department’s Worldwide NIV Workload by Visa Category table for fiscal year 2024 (FY2024), the most recent full year of available data. There were 55,324 E-2 visas issued and 6,108 applications refused, resulting in a refusal rate of 9.9%. The 55,324 issuances are also the highest annual total since at least FY1997. However, the figures only cover visa applications decided at U.S. embassies and consulates. They exclude E-2 changes of status approved by U.S. Citizenship and Immigration Services (USCIS) inside the United States, as well as E-2C visas.
On the other hand, the figures for FY2025 and February come from the State Department’s monthly issuance reports. The Department labels these reports as preliminary and subject to change. The Department also advises against adding the reports together to calculate a total for the fiscal year.
Therefore, the approximately 51,000 E-2 visas shown for FY2025 are only an estimate until the official annual Report of the Visa Office is published. The country panel shows how many E-2 visas each country received, not how many of its applicants were approved. The State Department does not publish E-2 refusals by country; therefore, country-level approval rates cannot be calculated from public data. The latter data is from the February 2026 monthly report.

What is the E-2 visa approval rate?
In fiscal year 2024, the most recent year for which the State Department has published both issuances and refusals, the E-2 visa approval rate was 90.1%. U.S. embassies and consulates issued 55,324 E-2 visas and refused 6,108 applications out of the 61,432 they reviewed. The State Department does not publish an official approval rate, so this figure was calculated using its issuance and refusal counts.
How is the E-2 approval rate calculated?
The rate is calculated by dividing the number of visas issued by the total number of applications decided that year. Both numbers are taken from the State Department’s Worldwide NIV Workload by Visa Category table, which is published once a year for each fiscal year (October 1 to September 30). This calculation is often called the E-2 visa success rate, acceptance rate, or issuance rate. They all describe the same figure.
However, percentages like “85–90%” that circulate online are usually not tied to a specific table or year. Therefore, it is important to verify the source of any E-2 rate you read.
What counts as a refusal?
Since FY2019, a refusal has been defined as an application that was still refused at the end of the fiscal year. For example, if an applicant is refused because documents are missing, but the case is resolved and the visa is issued within the same year, it is counted as an issuance. Before FY2019, the State Department counted every refusal during the year, including those that were later resolved, which is why older years show rates closer to 75–80%. The year-by-year table below illustrates how to compare the two periods.
What the E-2 approval rate does not include
- Change of status inside the United States. Investors who are already in the U.S. can request E-2 status from U.S. Citizenship and Immigration Services (USCIS) using Form I-129. These decisions are not included in the State Department’s figures, and USCIS does not publish a comparable E-2 rate.
- The distinction between investors and other applicants. The count includes investors, E-2 employees, and their spouses and children, all of whom receive E-2 visas. It also mixes first-time applicants and renewals.
- Country or consulate breakdowns. The State Department does not publish E-2 refusals by country or by consulate. Therefore, there is no official E-2 approval rate for any single country.
The 90.1% rate describes the share of E-2 applications decided at consulates in one year that ended with a visa issued. However, it does not predict the outcome of any individual application, as each case depends on its own set of facts.
E-2 approval rate by year (FY2013–FY2024)

In FY2019, the State Department changed how it counted refusals. Previously, it counted every refusal during the year. However, it now only counts applications that were still refused at the end of the year. This is why the raw rate jumped from 75% to 89% between FY 2018 and FY 2019. When comparing like with like, however, the E-2 approval rate has remained between approximately 88% and 93% since FY2013.
Roughly nine out of ten applications processed at U.S. consulates end the year with a visa issued.
How many E-2 visas are issued each year? (FY1997–FY2025)
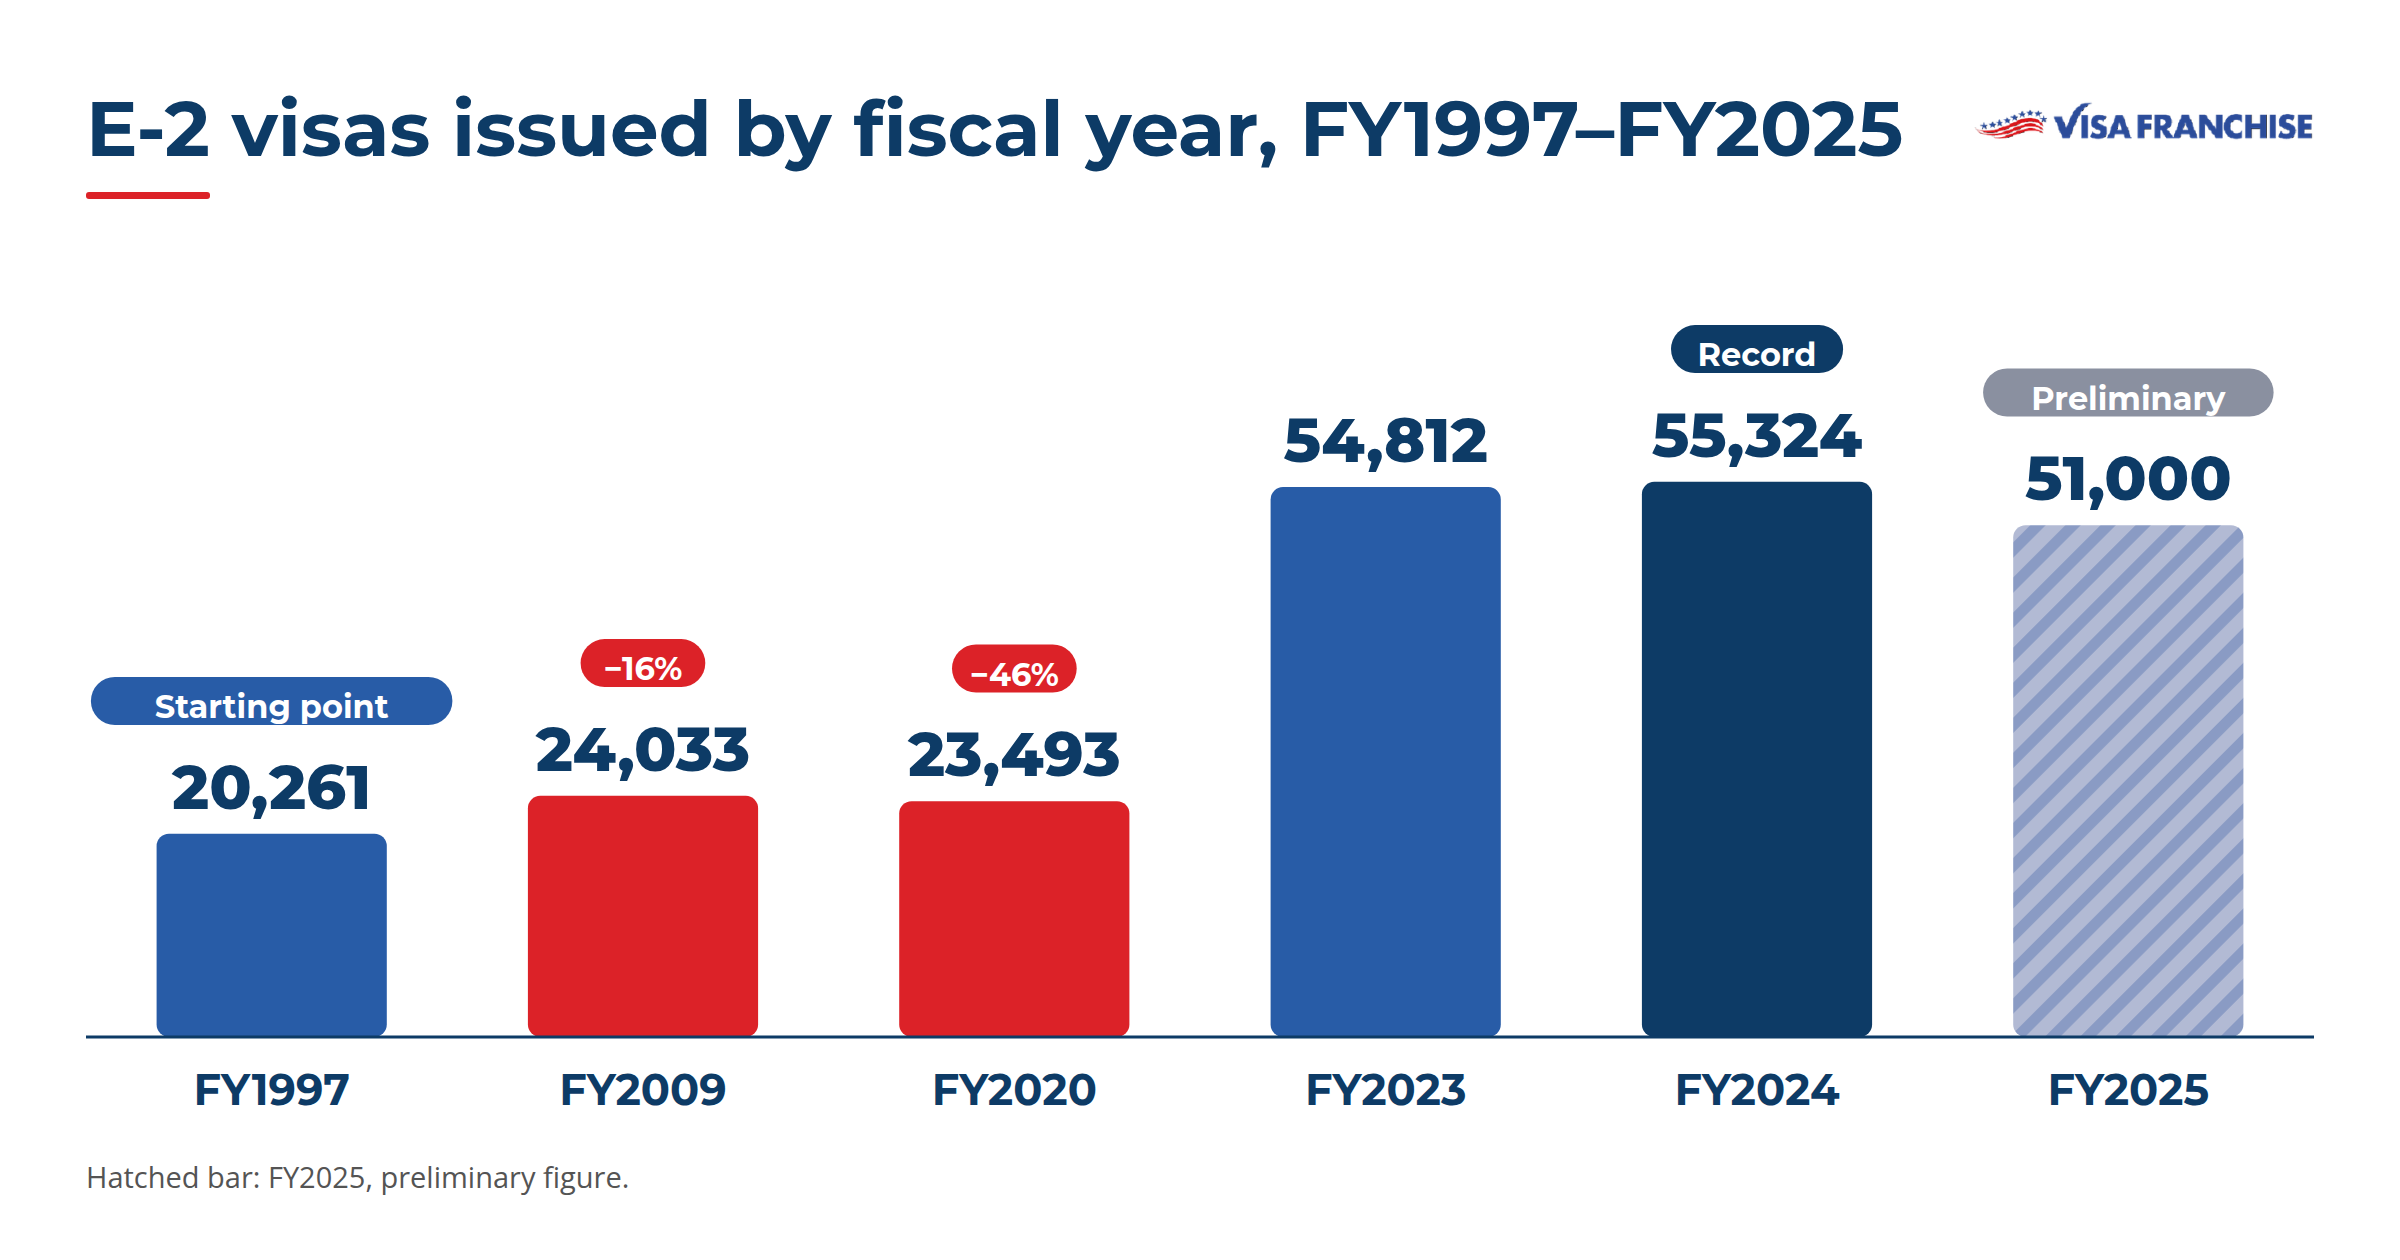
Since FY2022, the U.S. has issued roughly between 46,000 and 55,000 E-2 visas per year. The record was set in FY2024 with 55,324 visas issued, and preliminary monthly reports indicate that approximately 51,000 visas were issued in FY2025. That would make three consecutive years above 50,000, a level E-2 issuances had never reached before FY2023. Today’s totals are about two and a half times the 20,261 E-2 visas issued in fiscal year 1997.

FY2009: the first major drop
During the 2008–2009 financial crisis, E-2 issuances fell 16%, from 28,588 to 24,033. By FY2011, they were close to their FY2008 level again (28,245), and they continued to grow throughout the following decade.
What happened to E-2 visas in 2020?
FY2020 saw the lowest number of E-2 visas in two decades: 23,493, which was 46% fewer than in FY2019 and the lowest total since FY1999. In March 2020, the State Department suspended routine visa services at U.S. embassies and consulates due to the pandemic. Issuances recovered to 33,129 in FY2021 and to 45,878 in FY2022, which surpassed the pre-pandemic level.
FY2023 and FY2024: two record years
FY2023 (54,812) and FY2024 (55,324) are the two highest years in the series. FY2024 is the current record.
FY2025: about 51,000, the third-highest year
Adding up the State Department’s 12 monthly reports for FY2025 (October 2024 to September 2025) gives 51,047 E-2 visas, about 8% below the FY2024 record and still the third-highest year since at least FY1997. This is a preliminary figure: the State Department notes that monthly reports may change and advises against adding them together as a fiscal-year total. The official FY2025 figure will be published in the annual Report of the Visa Office.
E-2 visa data by country
According to preliminary State Department data, Japan, Canada, and South Korea received more than half of all E-2 visas in fiscal year 2025. Asian nationalities accounted for approximately 49% of the total, while Europe accounted for 31%, and North America accounted for 17%.

Japan
Japan has been the largest E-2 nationality every year since at least FY1997. Its 15,367 E-2 visas in FY2025 were 30% of the total. Its volume has barely moved since FY2021, staying between 15,000 and 15,900 a year.
Canada
Canada was second in FY2025 with 6,779 E-2 visas, its highest total since at least FY1997 and more than twice its FY2016 figure of 3,004. Canadian citizens don’t need a visa for most temporary stays in the U.S., but the E-2 is one of the exceptions under 8 CFR 212.1(a)(1): to work in E-2 status, Canadians need an E-2 visa issued by a U.S. consulate.
South Korea
South Korea set its own record in FY2024 with 6,778 E-2 visas, then fell 21% in FY2025, to 5,359. The trend reversed in the first five months of FY2026: monthly reports show 3,078 E-2 visas from October 2025 to February 2026, 43% more than in the same months a year earlier.
France
France is the fourth-largest E-2 nationality and one of the few top countries that grew in FY2025, from 3,574 to 3,806 (+6.5%), its highest total since at least FY1997. The first months of FY2026 show the opposite: 936 E-2 visas from October to February, 38% fewer than a year earlier.
Taiwan
Taiwan has grown more than almost any other nationality: from 463 E-2 visas in FY2016 to 2,921 in FY2024, more than six times as many. It fell 27% in FY2025, to 2,137, and rose 75% in the first five months of FY2026 compared with the same period a year earlier.
Germany, the United Kingdom, Italy and Spain
The four largest European nationalities after France issued fewer E-2 visas in FY2025 than in FY2016 and than in FY2024: Germany 3,271 (−16%), the United Kingdom 2,140 (−21%), Italy 1,241 (−19%) and Spain 1,298 (−10%), compared with FY2024. In the first five months of FY2026, Germany rose 12%, while the United Kingdom, Italy and Spain kept falling.
Israel
Israel shows the fastest growth since FY2016: from 82 E-2 visas to 757 in FY2025 (+823%). Until FY2018, Israeli nationals never received more than 83 E-2 visas a year; the increase began in FY2019, the year Israel became an E-2 treaty country, and continued every year since.
Mexico and Latin America
Mexico is the largest E-2 nationality in Latin America, with 1,739 E-2 visas in FY2025, 15% more than in FY2024, though still below its FY2016 total of 2,621 and its FY2013 peak of 3,001. Monthly reports show a further 10% increase from October 2025 to February 2026. Colombia held steady in FY2025 (614) but fell 41% in the first five months of FY2026. Argentina dropped from 675 to 278 in FY2025 (−59%) and fell another 43% from October to February. For Mexican investors, see our guide to the E-2 visa.
FY2026 so far: E-2 visas through February 2026
The State Department's fiscal year runs from October 1 to September 30. Therefore, FY2026 began on October 1, 2025. The most recent available monthly report covers February 2026, which is the fifth month of the fiscal year.
How does the E-2 compare with other work visas?
Higher rates for H-1B, L-1, and O-1 visas do not mean that those visas are easier to obtain. For these categories, U.S. Citizenship and Immigration Services (USCIS) usually approves a petition before the applicant reaches the consulate. Thus, the consular interview is a second review of a case that has already been screened.
For a first-time E-2 or E-1 application abroad, however, the consular officer decides the entire case, including the investment, the business, and the applicant’s role, without prior USCIS approval. With this in mind, the E-2's approval rate of 90.1% is close to that of the petition-based categories and well above that of visitor visas.
To learn more about how the E-2 differs from other visas in terms of requirements and the path to a green card, see E-2 Visa Explained.
Why are E-2 applications refused?
In fiscal year 2024, 6,108 of the 61,432 E-2 visa applications processed by U.S. consulates were denied, resulting in a refusal rate of 9.9%. While the State Department does not publish the reasons for E-2 refusals, the requirements that applications must meet are outlined in 8 CFR 214.2(e) and the State Department's Foreign Affairs Manual (9 FAM 402.9). An E-2 visa application is denied if the applicant fails to demonstrate one or more of the following: treaty nationality, a substantial investment that is committed and at risk, a real and operating business that is not marginal, and the investor’s role in developing and directing the business.
For what each requirement means and how it is documented, see E-2 visa requirements.
Visa Franchise is a business consulting firm, not a law firm, and does not provide legal advice. Immigration legal services are provided by independent, licensed immigration attorneys whom clients engage directly. Nothing here is legal advice or a guarantee of any immigration outcome. Eligibility and results depend on the specifics of each case and are assessed by the attorney.
Discover if you qualify to invest in a thriving U.S. franchise and secure your E-2 visa.
Check your eligibility
More Insights You Might Like
Explore related articles packed with expert advice, real stories, and practical tips to support your U.S. visa and relocation journey.